We Scale Ecommerce Brands.
One clear place for your whole store — Shopify, ads, email and finance together — so you protect profit and know exactly what to do today.
From the team behind $1.9B+ in annual Shopify revenue and 110+ brand partners.
Everything you need to run the day
Live KPIs, real profit clarity, and a daily report your whole team runs on — all connected, all in one place.
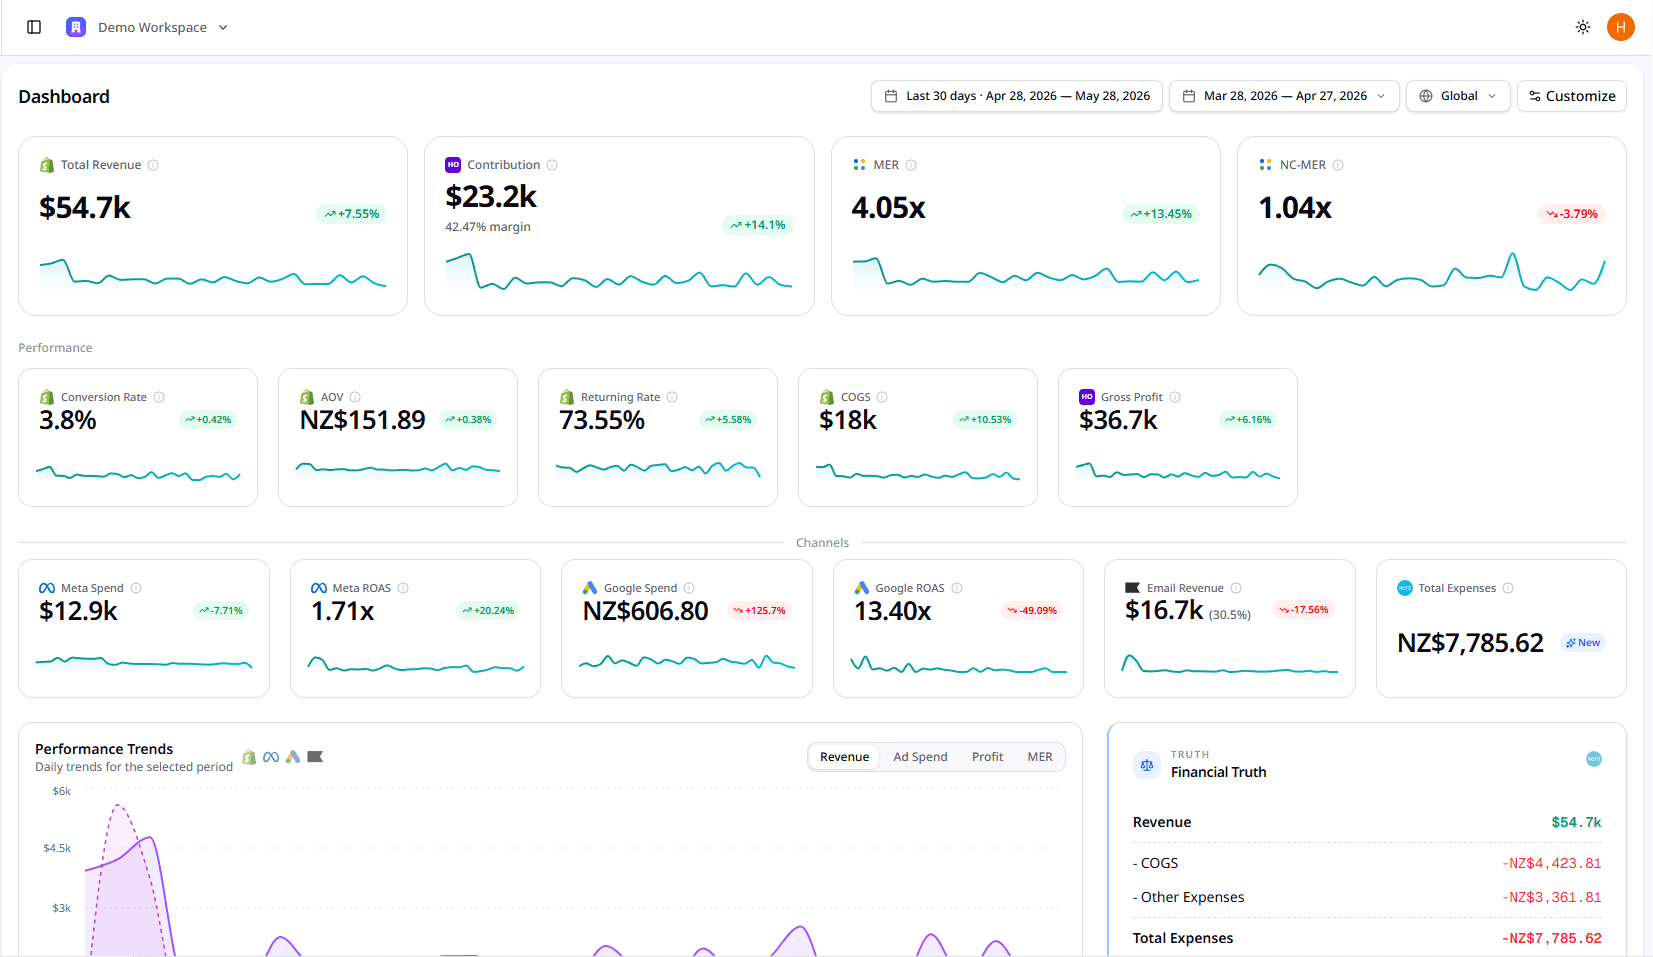
Every headline metric at a glance
Total Revenue, Contribution, MER and NC-MER up top — with Conversion Rate, AOV, ROAS, COGS and Gross Profit just below. Each with its trend and sparkline.
Connect your tools
One-click connections with health checks and on-demand sync, so your data is always current.
Track every trend
Daily Revenue, Ad Spend, Profit and MER across the period — broken down by channel, so you see what moved and when.
See where profit really goes
From the headline number down to what you actually keep — revenue through COGS, expenses and ad spend, to net and contribution profit.
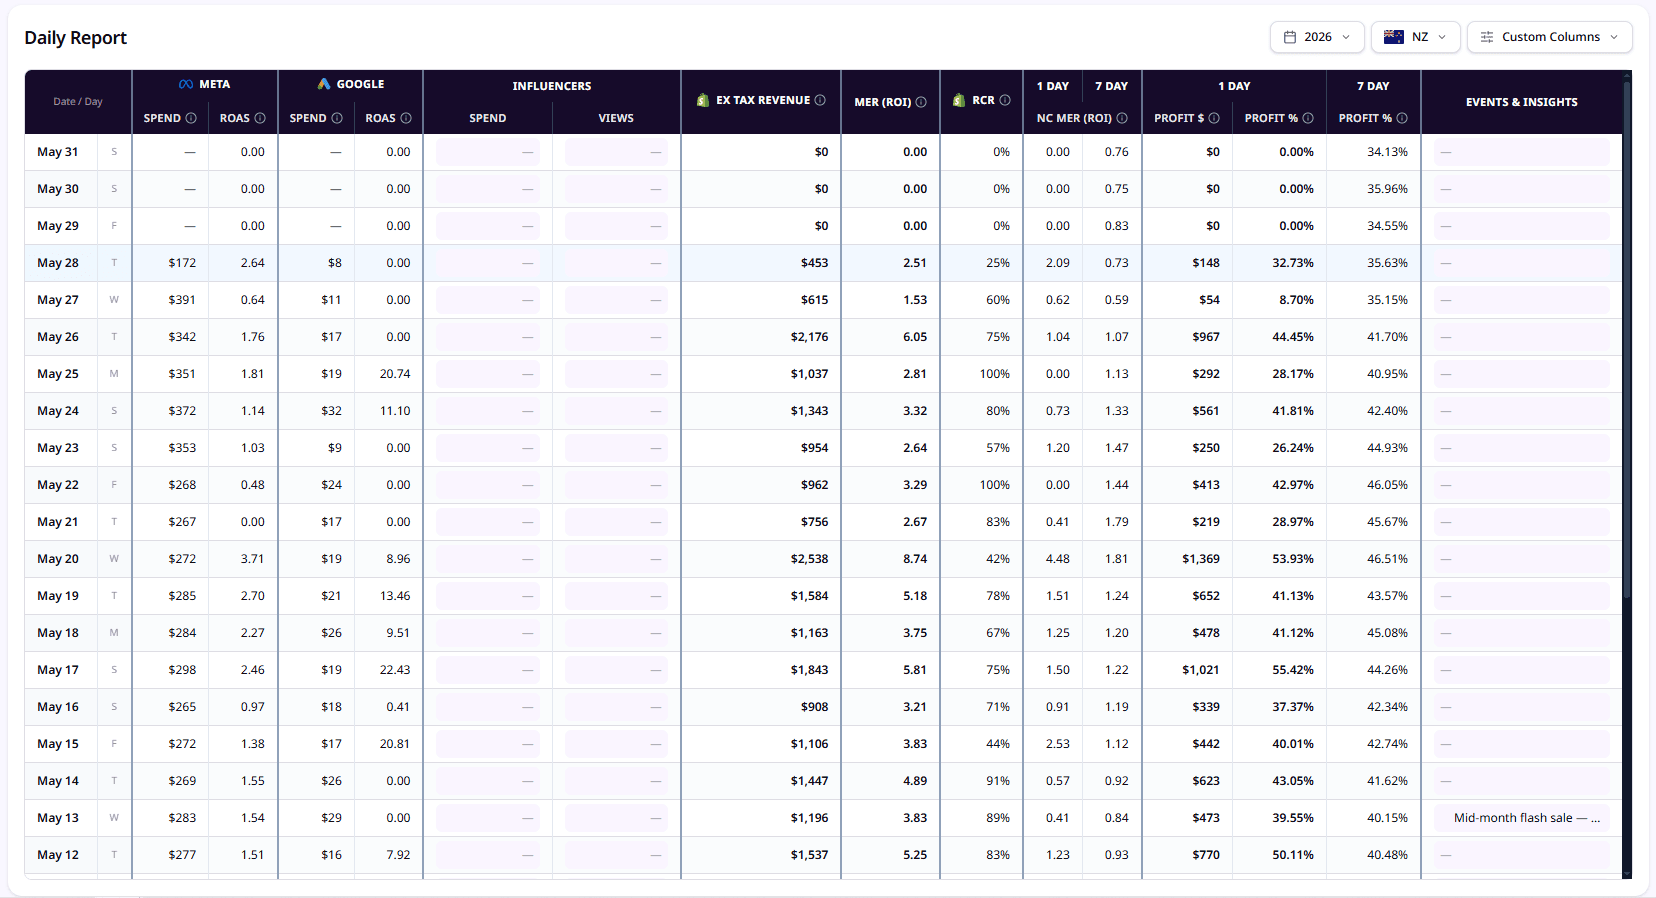
Your daily operating report
Every day’s revenue, ad spend, MER, RCR and profit in one table — with room for per-day notes and manual inputs like influencer spend.
For multi-market brands
Scale across every market
See every market clearly
Slice orders and ad spend by country across your dashboard and daily report — see exactly where you're winning.
More than a dashboard
Most dashboards stop at revenue. We take you all the way to profit — accurately, and built for how ecommerce actually works.
AI Head Office gives you clarity without complexity — one trusted place for performance, profit and the daily call. Less guesswork, fewer tabs, better decisions every day.
Pricing that scales with you
Lite
Set up your workspace and connect your Shopify store. Free to install — upgrade whenever you're ready.
Launch
Daily reporting across Shopify, ads and email — plus AI Head Office insights for growing teams.
Got questions?
Everything you need to know before you install — from setup to pricing. Still stuck?
Book a demoYour store’s command center. We pull Shopify, ads, email and finance into one daily operating report — the real numbers your team runs on, without the spreadsheet gymnastics.
Shopify, Meta, Google Ads, Klaviyo and Xero. Connect them once and orders, ad spend, email revenue and expenses flow in automatically — no manual exports, no copy-paste.
Free to install — set up your workspace and connect your store at no cost. Ready for more? Launch is $400/month, or $3,200/year and save 33%.
To the dollar. CVR, AOV and revenue are computed to match Shopify Analytics — formulas locked — so there’s no ‘why don’t these numbers line up?’ debate.